library(tidyverse)UNESCO
The Data
I wanted to explore a simple data set comparing UNESCO world heritage sites in Norway, Denmark, and Sweden. The original data is from UNESCO and was downloaded from TidyTuesday. The data can be accessed from the {pixarfilms} R package by Eric Leung.
unesco <- readr::read_csv('https://raw.githubusercontent.com/rfordatascience/tidytuesday/master/data/2024/2024-02-06/heritage.csv')unesco2 <- unesco |>
pivot_longer(
cols = c(`2004`, `2022`),
names_to = "year",
values_to = "number_of_sites"
)Let’s plot the data!
ggplot(unesco2, aes(x = country, y = number_of_sites, color = year)) +
  geom_point(size = 3) +
  labs(
    title = "UNESCO World Heritage Sites",
    x = "Country",
    y = "Number of Sites"
  )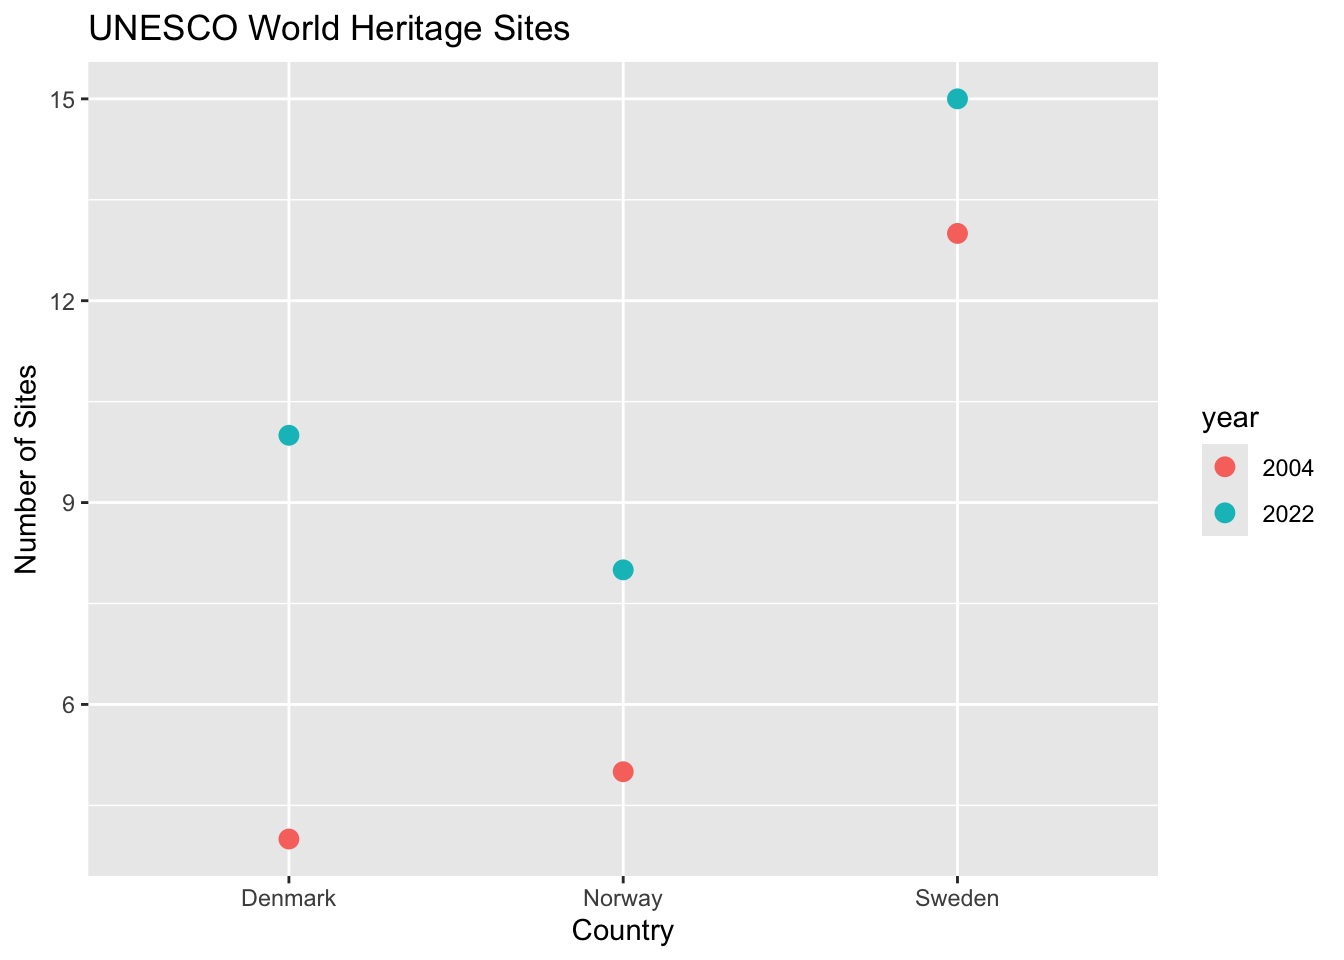
Showing the number of World Heritage Sites in Norway, Denmark, and Sweden across 2004 to 2022.
#References UNESCO World Heritage Centre - World Heritage List, whc.unesco.org/en/list/.